Answer (Quick Summary)
Philadelphia’s most dangerous intersections cluster on a handful of high-risk corridors—especially Roosevelt Boulevard, Broad Street, and the ramp/merge zones where I-95, I-76, and I-676 feed traffic into city streets. These locations combine wide multi-lane geometry, higher speeds, heavy turning and merging conflicts, and dense pedestrian/transit activity—conditions that repeatedly produce severe crashes.
Key Takeaways
- Philadelphia’s most serious and fatal crashes are not evenly spread out. A relatively small portion of streets accounts for most of the harm, which is why the same corridors keep showing up year after year.
- The City’s Vision Zero program targets “priority” corridors and intersections where severe crashes concentrate—useful for understanding where risk clusters.
- Roosevelt Boulevard remains one of the most notorious danger corridors, with long-running safety concerns tied to speed, width, and complex crossings.
- Automated enforcement corridors (red-light and speed-camera zones) are often selected because of crash history—those locations can matter for both safety and evidence.
- New “street realities” (delivery pressure, rideshares, motorized bikes/scooters, and illegal off-road vehicles like ATVs/dirt bikes) add unpredictability at already-busy intersections.
Editor’s Note
I was born and raised in South Philadelphia and have spent 69 years living, working, driving, walking, and traveling throughout the city.
Over those decades, I have watched Philadelphia change dramatically. Neighborhoods evolved. New highways were built. Traffic volumes increased. Parking became harder to find. Delivery trucks, rideshares, scooters, e-bikes, and changing commuting patterns transformed how people move through the city.
Some intersections that once felt relatively quiet became major traffic hubs. Others have been challenging for drivers and pedestrians for as long as I can remember. Places like Roosevelt Boulevard, Broad Street, Vine Street, and many of the city’s major transportation corridors have been part of Philadelphia’s traffic conversation for generations.
My perspective comes not only from living here, but also from working in Philadelphia for decades. As a court reporter in both the Philadelphia Court of Common Pleas and the United States District Court for the Eastern District of Pennsylvania, I saw firsthand how serious motor vehicle accidents affected individuals and families throughout the region.
This guide is intended as a practical educational resource. The goal is not to create fear about driving in Philadelphia, but to help residents, commuters, visitors, pedestrians, cyclists, and families better understand where serious crashes tend to occur and why certain intersections continue to present safety challenges.
Philadelphia remains one of the greatest cities in America. Understanding its streets, traffic patterns, and high-risk intersections is one small way we can all help make it safer for everyone who uses them.
If you’re in a crash anywhere in the city, the Philadelphia Injury Playbook (What to Do After an Accident in Philadelphia) walks you through the next steps—medical care, evidence, insurance, and deadlines.
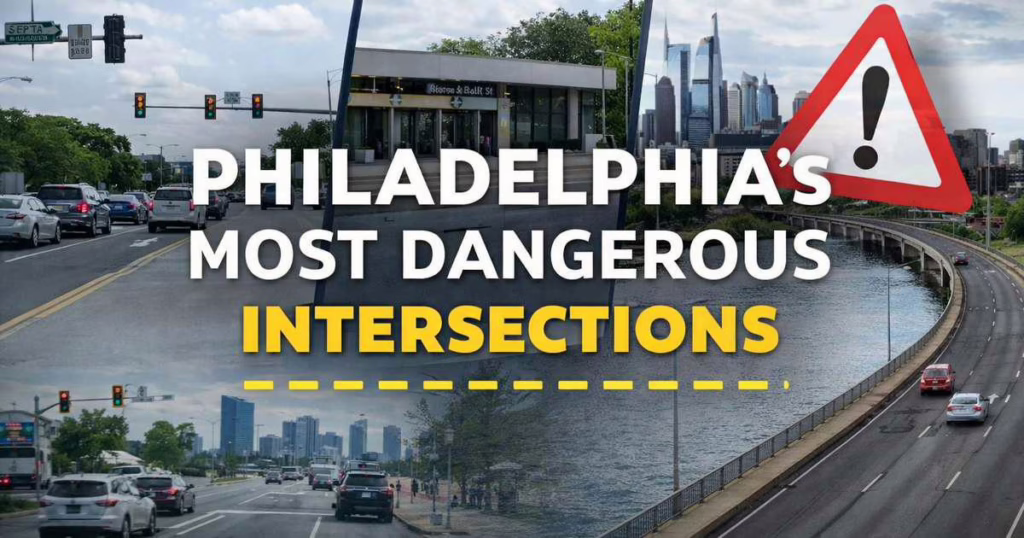
Philadelphia’s most dangerous intersections: Why crashes cluster
Philadelphia’s Vision Zero approach recognizes a hard truth: severe crashes concentrate on a small network of streets. The City’s action plan explains that about 12% of streets account for roughly 80% of traffic deaths and serious injuries—a pattern that makes many crashes predictable and preventable, not random.
That clustering usually comes from the same repeat factors:
- Wide, fast arterials that behave like highways inside the city
- Complex lane patterns (service roads, multiple turn lanes, awkward angles)
- Heavy pedestrian/transit activity near hubs, stations, and commercial corridors
- High merge/exit pressure near interstates, bridges, and airport routes
- Signal timing and turning conflicts that produce T-bones, left-turn collisions, and pedestrian strikes
The “Priority Intersections” Philadelphia identified for capital safety work
Philadelphia’s Vision Zero Capital Plan 2025 identifies Priority Intersections where fatal and serious injury crashes concentrate—this is one of the best “official” snapshots of where the City is focusing engineering changes.
Vision Zero Capital Plan 2025 – Priority Intersections
- B Street and East Ontario Street (Kensington area)
- 15th Street and Vine Street (Center City / I-676 edge)
- 62nd Street and Walnut Street (West Philly)
- Broad Street and Vine Street (Center City / I-676 edge)
- Belfield Avenue and Ogontz Avenue (Northwest/North Philly edge)
- 59th Street and Lancaster Avenue (West Philly / Overbrook area)
- Broad Street and Rockland Street (North Philly)
- 38th Street and University Avenue (University City)
- Belmont Avenue and Girard Avenue (West Philly / Park-side area)
- Old York Road and Wyoming Avenue (North Philly)
These aren’t the only dangerous locations—but they’re a strong, City-backed baseline.
Philadelphia’s most dangerous intersections by corridor (citywide list)
The Vision Zero Capital Plan 2025 also identifies “priority corridors” where severe crashes cluster. This matters because many of Philadelphia’s worst intersections are nodes on these corridors.
Priority corridors highlighted in the Capital Plan 2025
(Shown here in plain language—these are the same corridors listed in the City plan.)
- Broad Street corridor
- Market Street corridor (including East/West Market segments)
- Lehigh Avenue corridor
- Frankford Avenue corridor
- Allegheny Avenue corridor
- Cecil B. Moore Avenue corridor
- Hunting Park Avenue / Roosevelt Boulevard area
- Cobbs Creek area corridors
- Wissahickon area corridor
The intersections and zones Philadelphians consistently experience as “high crash”
Below is the expanded, citywide digest you asked for—organized by corridor/region, including intersections, highways, bridges, and airport traffic.
1) Roosevelt Boulevard: the historic danger corridor (Northeast)
Roosevelt Boulevard is repeatedly described as a uniquely hazardous corridor because its width, speed, and crossing complexity amplify mistakes into catastrophic outcomes. An AP report noted that the Boulevard has recorded dozens of deaths since 2016 and has long been central to Philly’s traffic-safety debate.
High-risk Boulevard nodes to know (common “watch zones”):
- Roosevelt Boulevard and Grant Avenue
- Roosevelt Boulevard and Red Lion Road
- Roosevelt Boulevard and Cottman Avenue
- Roosevelt Boulevard and Welsh Road
- Roosevelt Boulevard and Rhawn Street
- Roosevelt Boulevard and Levick Street
- Bustleton Avenue and Cottman Avenue (Roosevelt Mall area)
Why this corridor produces severe crashes:
- Multiple travel lanes + service roads create last-second merges and unexpected crossings
- High speeds reduce reaction time and increase impact force
- Long crossings place pedestrians and cyclists in the roadway for extended time
Camera/enforcement note (Roosevelt Boulevard):
The Philadelphia Parking Authority has stated the Boulevard includes multiple intersections monitored by red-light cameras, and that red-light running on the Boulevard declined after camera enforcement began.
2) Broad Street corridor: the “everything at once” artery (South Philly → North Philly)
Broad Street carries commuters, buses, pedestrians, deliveries, and turning traffic—often with wide lanes and frequent conflict points. It is also specifically listed among the City’s priority corridors.
Common Broad Street danger nodes (citywide):
- Broad Street and Vine Street (Center City edge / I-676 influence)
- Broad Street and Rockland Street (City priority intersection)
- Broad Street and Olney Avenue (transit-heavy conditions; frequent pedestrian conflicts)
- Broad Street and Hunting Park Avenue (high-speed + turning conflicts)
- Broad Street and Erie Avenue
- Broad Street and Oregon Avenue (South Philly station-area activity + turning volume)
- Broad Street and Washington Avenue (large intersection footprint + pedestrians)
3) Center City expressway edges: Vine Street Expressway (I-676) behavior spills into downtown
Some of the most dangerous “downtown-feeling” intersections sit right at the expressway edge, where ramp behavior meets dense city movement. Two of the City’s priority intersections sit here:
- 15th Street and Vine Street
- Broad Street and Vine Street
Why these zones can be risky:
- Drivers accelerate/decelerate abruptly near ramps
- Late lane changes and “make the light” decisions increase T-bones and sideswipes
- Pedestrians and cyclists are present where drivers are mentally still in “highway mode”
4) University City & West Philly: bridge/arterial mixes + heavy pedestrian volume
University City and West Philly can be uniquely risky because they blend city traffic with bridge/expressway access plus dense pedestrian and campus movement.
City-identified priority nodes include:
- 38th Street and University Avenue
- 62nd Street and Walnut Street
- 59th Street and Lancaster Avenue
Other West Philly nodes people consistently flag:
- Belmont Avenue and Girard Avenue (priority intersection)
- Market Street near 30th Street Station (high pedestrian and transit volume; turning conflicts)
5) River Wards & Kensington: industrial/residential mixes and heavy foot traffic
The Capital Plan’s priority list includes:
- B Street and East Ontario Street
These areas often combine:
- Loading zones + delivery activity
- Narrow sidewalks and frequent mid-block crossings
- Aggressive lane changes and bus stop friction
6) North Philly “geometry problems”: multi-leg intersections and confusing angles
Philadelphia has multiple intersections that behave like “five points” nodes—odd angles, extra approaches, and more chances for misjudgment. The Capital Plan includes priority nodes such as:
- Old York Road and Wyoming Avenue
- Belfield Avenue and Ogontz Avenue
These types of layouts increase:
- Right-of-way confusion
- Angle collisions during turns
- Pedestrian exposure across multiple traffic streams
High-collision zones that aren’t “one intersection”: highways, bridges, and airport traffic
You specifically asked to broaden beyond surface streets. Here’s the practical way to cover it in a PLC digest:
I-95 crash pressure zones (including bridge approaches and airport traffic)
Even when a collision happens “on the highway,” the highest risk often sits at interchanges and bridge approaches where:
- drivers merge aggressively,
- lanes drop or shift,
- traffic stops suddenly, and
- people are entering/exiting at different speeds.
In Philadelphia, this commonly includes:
- The I-95 “river-to-city” transition zones feeding Center City edges and waterfront arterials
- Bridge approach patterns where volume surges and decision windows shrink
- Airport traffic patterns where drivers are navigating exits, terminals, and commercial traffic
I-76 (Schuylkill Expressway) and I-676 (Vine Street Expressway) spillover zones
The reason these matter for a “dangerous intersections” article is simple: highway driving behavior doesn’t stop at the exit. When drivers come off a congested expressway and hit a signalized intersection, the risk spikes—especially where pedestrian volume is high (University City / Center City edges).
Philadelphia International Airport movement corridors
Airport traffic creates a recurring crash pattern:
- unfamiliar drivers
- rideshare stop/start behavior
- commercial vans and shuttles
- abrupt lane changes to catch an exit or terminal
If you want one simple “reader takeaway” line:
Treat airport approaches like an active merge zone—slow down early and expect last-second lane changes.
Micro-mobility and “new street behavior”: e-bikes, scooters, motorcycles, three-wheelers, ATVs, dirt bikes
Philadelphia traffic isn’t just cars anymore. A realistic “dangerous intersections” guide should acknowledge what people experience daily:
What’s changing at intersections
- Motorized bikes and scooters move faster than pedestrians but don’t always behave like cars.
- Delivery pressure (food and package delivery) increases sudden stops, U-turns, and curbside conflict.
- Motorcycles and three-wheeled motorcycles can appear in blind spots and accelerate quickly through gaps.
- ATVs/dirt bikes (often illegal on city streets) create unpredictable, high-risk maneuvers—especially at wide intersections and along long, straight corridors.
New Jersey enforcement note (useful for regional readers and Philly reality)
If you reference NJ policy as a “news alert,” here’s the accurate way to say it:
- New Jersey’s Motor Vehicle Commission explains that motorized bicycles / mopeds require registration and insurance, and riders must generally be at least 15 (with additional rules for licensing/operation).
- NJ also distinguishes ATVs/dirt bikes as off-road vehicles with their own age/registration rules—this is often where the “14 years old” rule shows up.
Practical point for this blog: whether the vehicle is legal or not, intersections become more dangerous when faster “micro-mobility” traffic mixes with turning vehicles and pedestrians.
Why intersections are so dangerous: design + behavior
Most intersection crashes come down to two buckets: (1) the physical setup, and (2) human decisions.
Design factors that increase crash risk
- Poor sightlines (parked vehicles, buildings, poles, vegetation)
- Multi-lane crossings and confusing turn lanes
- Service-road layouts (a Roosevelt Boulevard problem)
- Inadequate signage or worn lane markings
- Transit hub congestion (bus stops, station entrances, ride pickups)
- Long crosswalk exposure time for pedestrians
Driver behaviors that repeatedly cause intersection crashes
- Distracted driving (phone, GPS, screens)
- Speeding and “beating the light”
- Aggressive lane changes and tailgating
- DUI / impairment
- Left-turn misjudgments (classic T-bone scenario)
- Failure to yield to pedestrians in crosswalks
Philadelphia’s most dangerous intersections: What to do after a crash
- Get medical care first (and follow up).
- Call police and make sure the location is recorded accurately (intersection names matter).
- Take photos/video: signals, lane markings, skid marks, vehicle positions, debris field, crosswalks.
- Identify cameras: red-light cameras, speed cameras, SEPTA/parking cameras, nearby businesses.
- Get witness contact info immediately.
- Preserve everything (clothing, vehicle condition, dashcam files, phone metadata).
If you were hurt in a crash at one of Philadelphia’s known high-risk intersections, the next step is making sure the evidence is preserved and your options are clear.
Quick Reference: Philadelphia “High-Risk” Intersections (citywide digest)
This combines City-identified priority intersections plus the corridor-based high-risk nodes people consistently search for.
Vision Zero Capital Plan 2025 – Priority Intersections (official list)
- B Street and East Ontario Street
- 15th Street and Vine Street
- 62nd Street and Walnut Street
- Broad Street and Vine Street
- Belfield Avenue and Ogontz Avenue
- 59th Street and Lancaster Avenue
- Broad Street and Rockland Street
- 38th Street and University Avenue
- Belmont Avenue and Girard Avenue
- Old York Road and Wyoming Avenue
Additional high-search “danger nodes” (corridor-based)
- Roosevelt Boulevard and Grant Avenue
- Roosevelt Boulevard and Red Lion Road
- Roosevelt Boulevard and Cottman Avenue
- Roosevelt Boulevard and Welsh Road
- Bustleton Avenue and Cottman Avenue
- Broad Street and Olney Avenue
- Broad Street and Hunting Park Avenue
- Broad Street and Oregon Avenue
- Broad Street and Washington Avenue
- Market Street near 30th Street Station (turning + pedestrian conflict zone)
External sources section
Sources used for safety context and city-identified priority corridors/intersections. Intersections change over time; always check for the most current updates.
Sources
- Vision Zero Capital Plan 2025 (PDF)
- Vision Zero Philadelphia: High Injury Network (interactive map)
- City of Philadelphia: Automated Speed Enforcement Expansion Report (May 2024) (PDF)
- Philadelphia Parking Authority: Red Light Program Annual Report (PDF)
- AP: Roosevelt Boulevard safety funding / ongoing crash concerns
Explore More Philadelphia Safety Guides
Dangerous intersections are only one part of Philadelphia’s traffic and pedestrian safety picture.
- Philadelphia Neighborhood Safety Hub
- Broad & Oregon South Philly
- South Philadelphia Traffic Safety
- Philadelphia Injury Playbook
- Pedestrian Safety in Philadelphia
Explore additional guides covering traffic safety, neighborhood conditions, accident prevention, and injury resources throughout Philadelphia.
Philadelphia Streets Then & Now
Many longtime Philadelphians remember when traffic was lighter, parking was easier, and some of today’s busiest intersections felt very different. As the city grew, traffic patterns changed, neighborhoods evolved, and certain intersections became far more congested than they once were.
Explore more stories, neighborhood memories, and local history at the Philadelphia Nostalgia Hub.
Related Resources
Explore more guidance on accident risks, insurance, and what to do next:
Frequently Asked Questions
What evidence helps prove fault if there was no traffic camera footage?
Even without a traffic-camera clip, strong cases are built with witnesses, police reports, vehicle damage analysis, scene photos/video, 911 calls, and nearby business security footage. The key is moving quickly—private camera systems often overwrite footage.
Who is usually at fault in a left-turn intersection crash?
In many left-turn crashes, the turning driver has the duty to yield. But fault can shift if the oncoming driver was speeding, ran a red light, or was otherwise negligent. The specific evidence (signals, timing, witness accounts, video) controls the outcome.
What if I’m partially at fault?
Pennsylvania follows a form of comparative negligence: your recovery can be reduced by your percentage of fault, and if you’re over the threshold you may be barred from recovery. (This is one reason insurers fight hard over percentages.)
How long do I have to file a claim?
Deadlines depend on the facts, but waiting is risky because evidence disappears long before legal deadlines hit. If a government entity is involved, special notice rules may apply.
What if the other driver was uninsured or fled the scene?
You may still have options through your own auto policy (UM/UIM coverage), and an investigation can sometimes identify the fleeing vehicle through cameras, witnesses, and vehicle debris patterns.